Brian Sommers
Cynthia Pope
Department of Geography, Anthropology, and Tourism
Central Connecticut State University
TEACHER'S SNAPSHOT
Subjects:
Economics, Food, Geography, Immigration, Migration
Course Topics/Big Ideas:
Cultural Diversity and an American National Identity, Globalization and Economic Interdependence, The Impact of Geography on History
Town:
East Hartford, Hartford, Middletown, Milford, New Haven
Grade:
High School
Lesson Plan Notes
Throughout the world, food, history, climate, and geography are intertwined. People use the foods available to them to create cuisines that reflect the places from which they come. As a country shaped by immigration, these different cuisines have left an imprint on the food we eat and what is available in restaurants and grocery stores. Over time, local and regional foods have evolved as well. As you travel across the United States, you will find that the foods change based on the different histories, cultures, and geography that intersect in a place.
ESSENTIAL QUESTION
SUPPORTING QUESTIONS
- How do the ethnic or regional foods popular in cities outside Connecticut compare with those popular within Connecticut?
- How are the foods that we eat connected to the history of immigration to the United States?
ACTIVITY
1. Introduce the compelling and supporting questions and have students brainstorm additional supporting questions. As a class, discuss prior knowledge (or assumptions) that students have about this topic (or have students jot down written responses individually).
2. To investigate the first supporting question (“How do the ethnic or regional foods popular in cities outside Connecticut compare with those popular within Connecticut?”) students will compare information from different Metropolitan Statistical Areas with similar population size. Two sample sets are identified. Set 1: New Orleans, Salt Lake City, and Hartford/East Hartford/Middletown and Set 2: Baton Rouge, El Paso, and New Haven/Milford. A chart providing the population data is provided in the toolkit. Break the class into two groups, with one half exploring Set 1 and the other Set 2.
3. Model the inquiry using a city NOT included in one of the two sample sets, for example, Tucson, Arizona. Using the ethnicity maps from ValpoScholar in the toolkit, Google, Google Maps, and/or other online research tools, model an investigation of Tucson:
- Where is it?
- What ethnic/cultural groups make up the population of Tucson?
- What brought these different groups to Tucson?
- Think about how that history might be reflected in the city’s foods, e.g. if there are lots of people from ethnicity X in Tucson, what would you expect to see in terms of the foods available in the city?
Using Google Maps, search the area for restaurants and/or markets that are linked to the history of the city. For example, since Mexican culture has been an important influence in the city of Tucson, students can search for “Mexican restaurant” or “Mexican grocery/market” by entering those terms in the search block. Google Maps will show groups of responses on the map, as well as Google reviews of each. Student can then look through the lists of responses to see the geographic patterns on the map.
4. After the model inquiry, students will work individually, in pairs, or in small groups to conduct similar inquiries into the three metropolitan areas in their assigned sample set and make comparisons between them.
- What similarities do they see between the cities? Why do they think that is?
- What differences? What can they infer from the differences?
- What patterns do they notice within metropolitan areas?
- Which popular cuisines in each city can be linked to immigration/migration history and which are regional specialties that evolved over time? Do any examples fall into both categories?
5. Discuss students’ findings and conclusions, being sure to make comparisons between the two sample sets. How have their inquiries helped them answer the supporting and compelling questions, and what new questions have arisen? Discuss ideas for where/how they can find out more.
OPPORTUNITIES FOR ASSESSMENT
- Students will create a presentation focusing on one of the cities/metropolitan areas that they investigated.
- Students will research one recipe from one of the cultures prominent in a city they investigated and create a map or infographic showing where the ingredients originate as a way to start a discussion about the globalization of culture. This “Origins of Crops Interactive Map” is a good resource for this project.
- More advanced students or those studying AP Human Geography will create a StoryMap of findings using ESRI software, which is available publicly. See: storymaps.arcgis.com/stories.
RESOURCE TOOL KIT
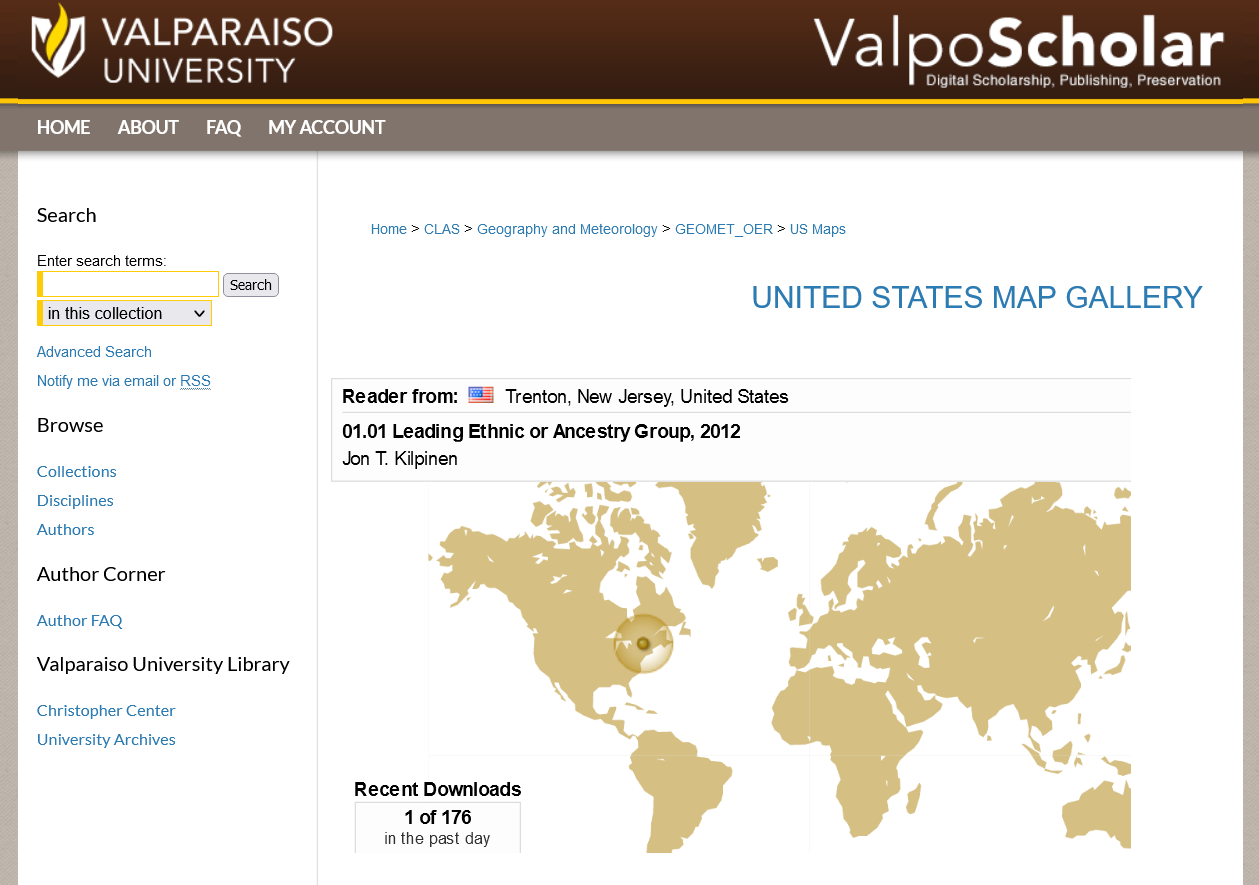
ValpoScholar: United States Map Gallery, Valparaiso University.
This resource provides numerous maps showing ethnic break-down by county in the United States. Individual maps can be viewed online or downloaded.

“Metropolitan Statistical Area Populations” Chart, 2021.
ADDITIONAL RESOURCES
Places to GO
Arrange a visit to a restaurant or market in your area that connects to an immigrant/migrant group. As a class, conduct some research in advance and develop a list of questions for the proprietor.
Go on a walking/bus tour in a larger town or city and explore the range of ethnic/regional foods available.
Things To DO
Have students try following a recipe at home to make a dish that comes from a culture different than their own. They can make a video, create a slide presentation, or write a short reflection about the experience.
Invite a guest into the classroom to talk about cuisine from his/her culture. If possible, have the guest bring some common ingredients and/or do a short demonstration.
Watch the “Black Food with Bryant Terry” video podcast from the International Festival of Arts and Ideas
Websites to VISIT
Articles to READ
Cherfals, Jeremy. “A Map of Where Your Food Originates May Surprise You.” The Salt, NPR. June 13, 2016.
Mackendrick, Norah. “Foodscape.” Jargon: Key Concepts in Social Science Research. August 22, 2014. Volume 13; Issue 3; pages 16-18.
“The Essential Role of Immigrants in the U.S. Food Supply Chain,” Migration Policy Institute, April 2020.
“58 Most Famous Foods Around the World.” World Travel Connector, March 13, 2021.