Melissa Zablonski
Putnam High School
TEACHER'S SNAPSHOT
Subjects:
African Americans, Colonial History, Slavery & Abolition
Course Topics/Big Ideas:
Expansion, Influence, and Economic Growth, Origins of United States Democracy and National Identity
Town:
Statewide
Grade:
Grade 8, High School
Lesson Plan Notes
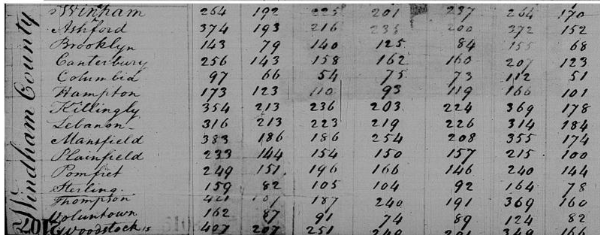
Historical United State Censuses offer a different perspective into the social, economic, and political cultures of the past. The way groups are identified within the census provides a glimpse into the social hierarchy of the time, and when looking at censuses over time, changes in population and the ethnic make-up of places can be observed. Connecticut abolished slavery in 1848. In this lesson, students will become familiar with reading Connecticut censuses beginning in 1756 and ending in 1840. Using the data from the censuses, students will track changes in the enslaved population of Windham County—and other counties in Connecticut—over time. Students will also make inferences about cultural changes towards Black Americans in Connecticut based on the identifiers used within the census.
ESSENTIAL QUESTION
SUPPORTING QUESTIONS
- How did the number of enslaved people in Windham County change over time?
- How did the census change the way it labeled Black Americans over time?
- To what can these changes be attributed?
ACTIVITY
Introduction
- Teacher asks students the purpose of the census and the data it provides.
- Teacher projects “Census of 1782” on the board. Students discuss what they notice about the chart in terms of its labels, organization, etc.
- Students Think-Pair-Share about how the census can be used to explore changes in culture, attitudes, politics, and economics over time. Resources on effective use of the “Think-Pair-Share” strategy can be found at Facing History & Ourselves.
Activity #1
- Students will complete the worksheet as they make observations about the changes in Windham County’s Black and enslaved populations from 1756-1840. Students will use the censuses from several points during that time period to complete the activity.
Activity #2
- Using the same worksheet, students will graph the changes in Windham County’s Black and enslaved populations over time. Students can choose which type of graph to create and how to display the information. For example, some may graph the total Black population over time, while others may have separate lines or bars to show the change in enslaved population versus freed Black population over time.
- Students will analyze the trends in population change over time in Windham County. They will reflect on possible causes of these changes, such as laws, abolition, etc.
OPPORTUNITIES FOR ASSESSMENT
- Using FamilySearch.org, students can follow the same steps as they did in Activity 1 to track the Black and enslaved populations of the county in which they live. To do this, have students create a free account. Next, students click on the census for the year and county they wish to explore. Each page of the census will be available, showing every person that lived in the county. They then need to search the census to find the page that summarizes the data for their county. (This is usually found towards the end of their county’s section in the census.) Students can then create a graph, like in Activity 2, that depicts the change in the Black population in their county over time. If students are not able to make an account on FamilySearch.org, students can use Decennial Census Official Publications from the U.S. Census Bureau for their research. Not all censuses are available digitally, but students still have the opportunity to view at least two censuses prior to 1850 to complete the activity.
- Students will return to FamilySearch.org and revisit one or more censuses for their county. This time, students will look for individuals who enslaved people or had free Black people living in their house. They may also look for any Black heads of households they might find. Students will identify the name of one individual who enslaved someone, had a freed Black person living in their home, or who was a Black head of household. They will identify the number of people living with that individual and any other information provided by the census. Students will conduct outside research using the internet, a local historical society, or other methods to find additional information about the people they identified. They may try to locate primary-source documents related to that individual, or secondary-source documents that will help them learn more about that person’s life.
RESOURCE TOOL KIT
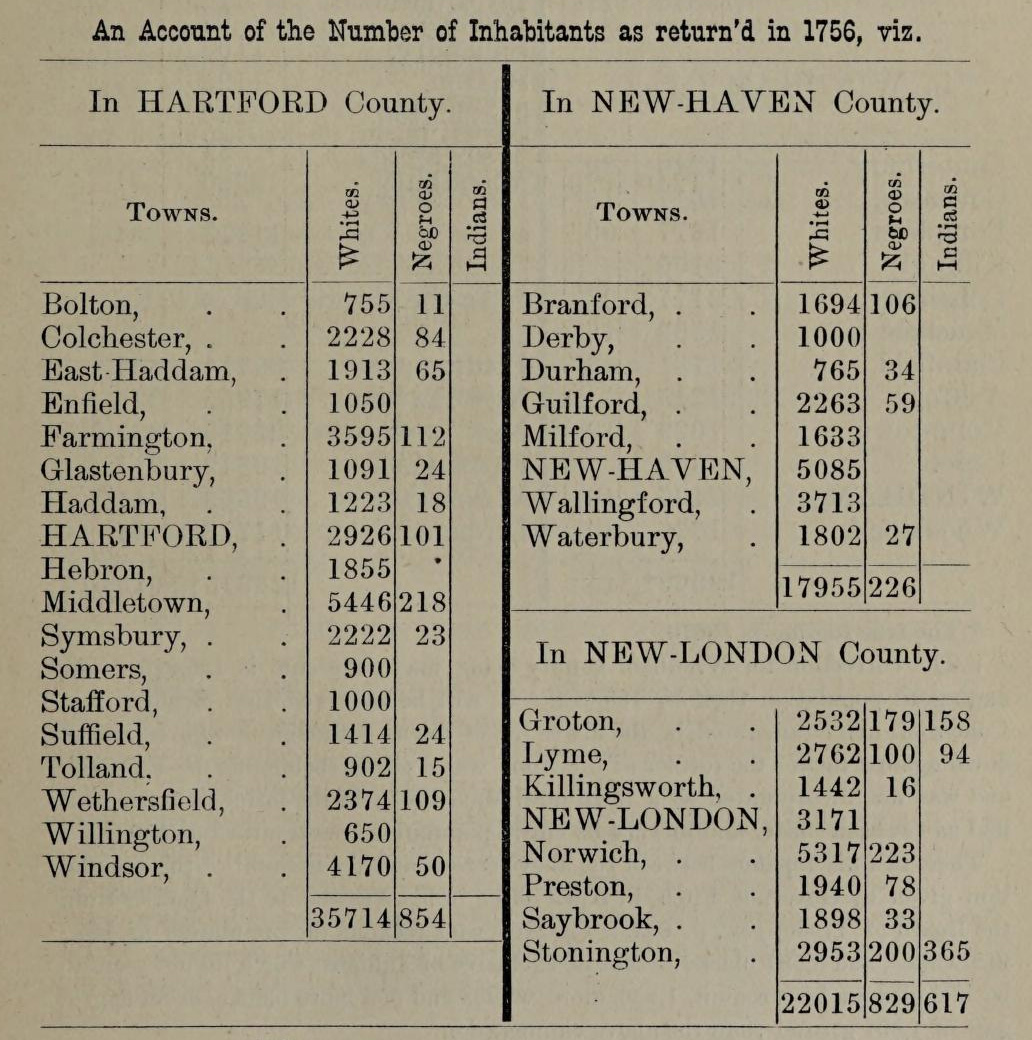
1756 Census. Published in: Hoadly, C.J. (1877). The public records of the colony of Connecticut: From May, 1751, to February, 1757, Inclusive. Hartford: Case, Lockwood, and Brainard Co. Begin analysis on page 617. Courtesy Internet Archive.
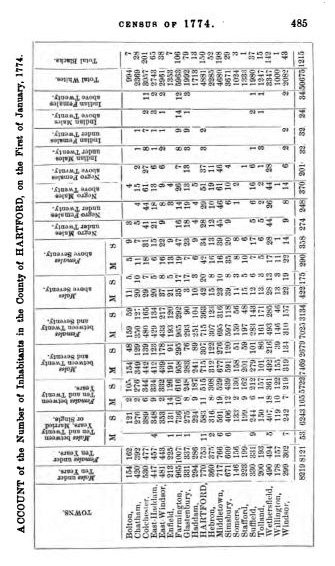
1774 Census. Published in: Hoadly, C.J. (1887). The public records of the colony of Connecticut: From October, 1772, to April, 1776, Inclusive. Hartford: Case, Lockwood, and Brainard Co. Begin analysis on page 485. Courtesy Internet Archive.
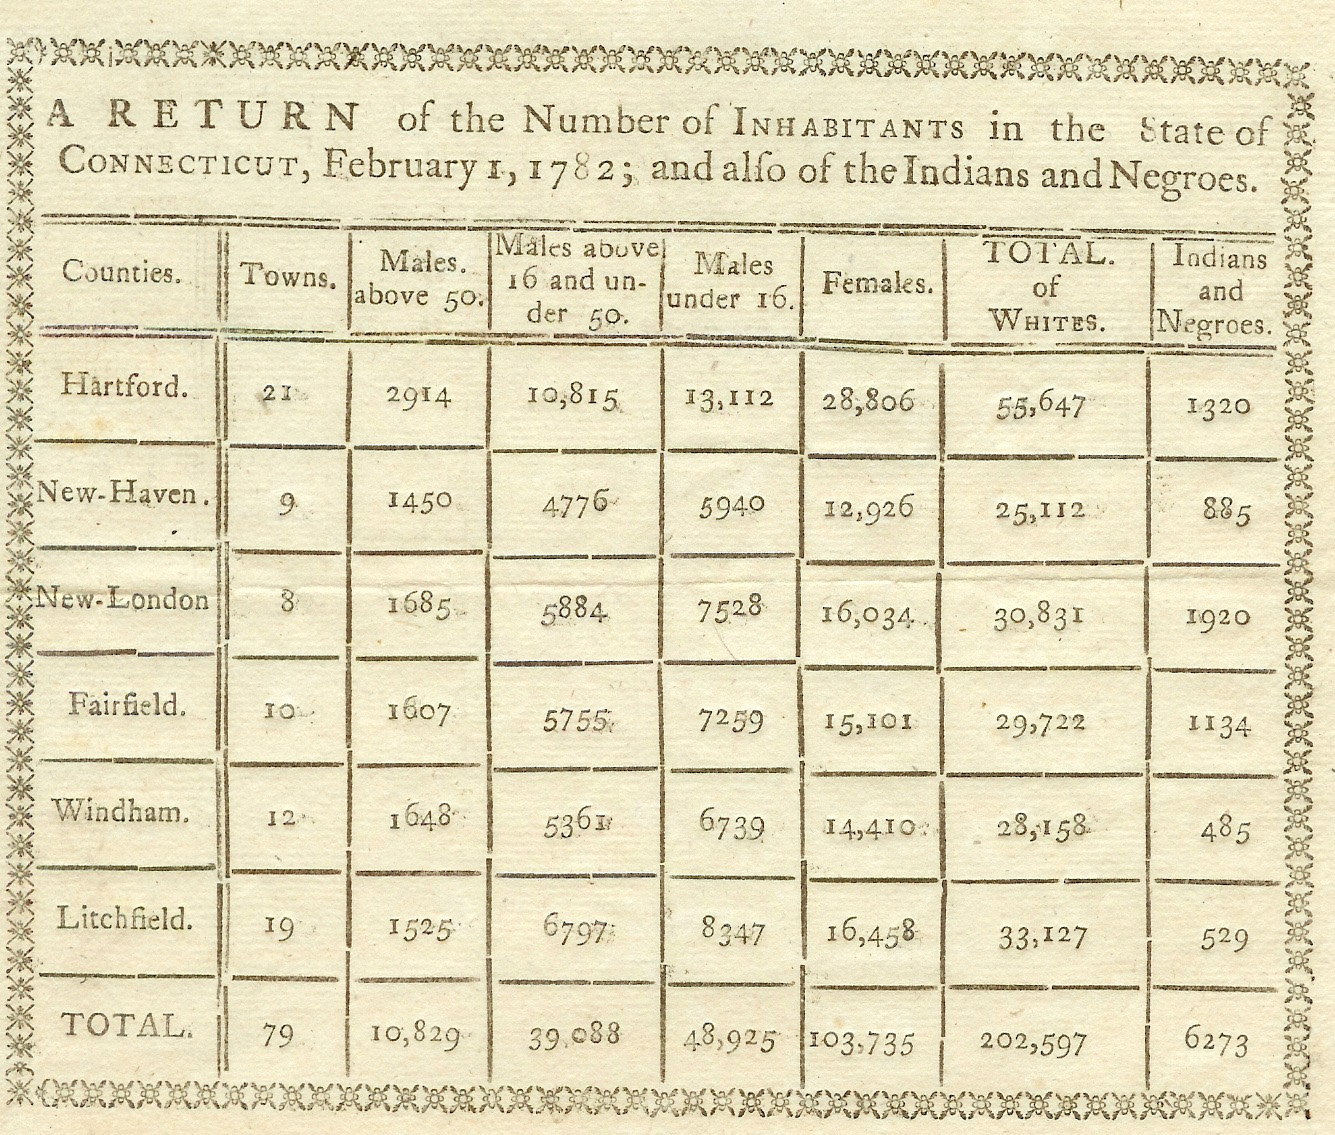
1782 Census. “A return of the Number of inhabitants in the State of Connecticut, February 1, 1782; and also of the Indians and Negroes.” Available online courtesy Connecticut State Library.
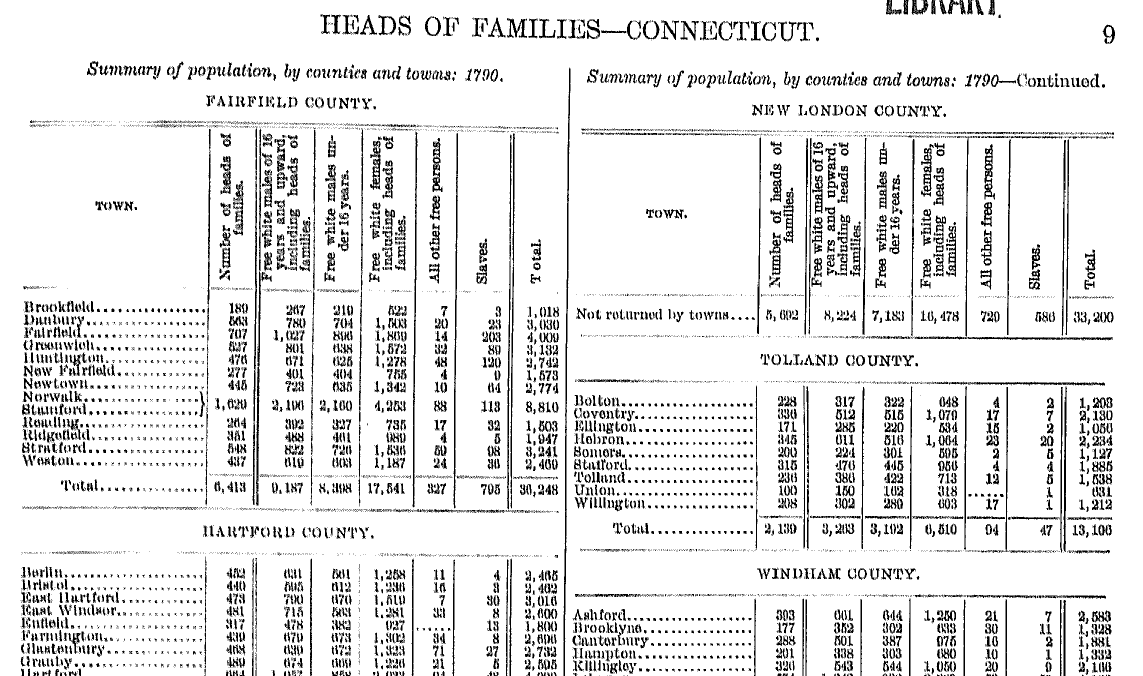
1790 Census. Published in: Bureau of the Census. (1908). Heads of families at the first census of the United States taken in the year 1790: Connecticut. Washington D.C.: Government Printing Office. Starts of page 9 of document.
1810, 1830, and 1840 Censuses. United States Census Office. Connecticut, 1790 thru 1840 federal census: population schedules. Washington, D.C.: National Archives & Records Administration, 1938, 1949, 1950, 1958-1961, 1969.
ADDITIONAL RESOURCES
Places to GO
Connecticut State Library, Hartford, where you can view census documents
Things To DO
Explore the use of the census on the following exhibit panels from the Here All Along exhibit at the Windham Textile and History Museum:
Websites to VISIT
National Archives Census Records
Colonial and State Census Records, Connecticut State Library
Measuring Race and Ethnicity Across the Decades: 1790–2010, United States Census Bureau
Articles to READ
Editors. (2002, September 29). “Connecticut slave owners in 1790.” Hartford Courant.
Harper, D. (2003). “Slavery in Connecticut.” Slavery in the North.
Mattatuck Museum. (2004). Timeline of Connecticut slavery. Fortune’s Story.
“Race and the Census: The ‘Negro’ Controversy” by D’Vera Cohn, January 21, 2010, Pew Research Center.